There are a lot of articles telling you that L&D should use data more. They’re not wrong. But, as we know from our work with clients to enable a data-driven approach, it’s easier said than done. L&D departments rarely have the numbers, time, or technology in place to get the quick fixes most publications presume are available.
So, where to start to build a data-driven L&D function? When few companies are doing it well, how do you find best practice?. And even where they are, businesses have such disparate contexts and goals that no single answer fits all.
There’s another argument that many of the publications and businesses push when they’re trying to sound ahead of the curve. It’s one that is demonstrably untrue: that you grab the data and you’re sorted. But just having the data alone isn’t enough.
Peter Cappelli went so far as to argue in HBR that there’s no such thing as big data in HR. We disagree. Rich data sources exist in HR - but they’re not typically being harnessed (and processed and analysed) so their value isn’t apparent. Businesses need to understand how to pull it together, and what questions to ask, to get any genuine value. To share how that looks in practice, here’s a run through of the sorts of data we work with for clients, what we do with it, and how they use it.
We’re splitting this up into the three major components of our data collecting process: the skills framework, Content Intelligence, and the LXP itself.
Skills framework
There are various names for this. It could be competency framework, skills ontology, skills taxonomy. They all refer to essentially the same thing. A system of defining the key skills for an organisation, working out how your organisation wants to describe them, and laying out how they interrelate.
The traditional methods
To understand how we pull together skills data, it’s important to grasp the two extremes most organisations tend towards. Bottom-up or top-down skills.
Top-down skills frameworks
In a top-down approach, organisations usually employ external consultants to conduct analysis. This often involves the consultants’ own experience, guiding company strategy, or potentially some interviews. The consultant then proposes a set of skills recommendations in a report.
This approach is good at ensuring that the company is focussing on skills relevant to long-term strategy. But it can often miss the practicalities of job roles and the intrinsic priorities and motivations of learners.
Bottom-up skills frameworks
The bottom up approach is connected to the ground. Skills requirements are generally prioritised and described by learners. This can come from where learners explicitly state they want to develop, or it can be based on LXP usage data. It’s most notably used by LXPs like Degreed.
While this approach is more democratic, self regulating, and connected to day-to-day reality, it can be short sighted. Learners often focus on short-term goals over long-term strategy. Leaders are less able to guide skills development and identify systemic needs and interventions with this approach.
How Filtered collects skills data
The Filtered approach is to go for the best of both worlds. Combine the on-the-floor perspective of the bottom-up approach with the longer-term strategy of the top-down method. To do this effectively, we use a wide range of data sources.
Top-down data sources
These data need to tell us what high profile initiatives are key for the company, what skills might support those, and what’s likely to change over time. They include:
- Business plans
- Corporate strategy documents
- Industry/sector whitepapers
- Interviews with leadership
Bottom-up data sources
We collate all relevant client data that has a bearing on what’s valuable in their organisation. This includes:
- Usage data from their LMS/LXP
- Search data
- Surveys (often simple questions like: “what are three important capabilities to you?”; “what are three business project are important to you?”; “will they be the same in three years time”)
- Role definitions
- Existing capability frameworks for different roles
- Data from a range of HR sources and technologies (that Josh Bersin explains in detail in this podcast)
How we make that data useful
Bringing this data together doesn’t mean it’s telling you anything. It’s a mix of quantitative and qualitative data. It’s all structured differently and some sources are more important than others. So, how do you turn it into insights that inform your skills strategy? With a mix of human consultation and algorithms.
Algorithms picking the data for the humans
Often clients have valuable usage data from their LMS but the metadata (tagging) for the content itself is poor. To solve this, we apply our Content Intelligence algorithms (more on that later) to get a better picture of which exact skills were receiving the highest demand.
Humans picking data for the algorithms
In another case we wanted to build a picture of what was useful from a client’s search data. Search data can be forbidding, with very large numbers of different queries - too many to map manually. So, we applied an 80/20 approach. We found that the top 20% of search terms accounted for over 80% of searches. Even without language processing algorithms, this sort of focus can make big data sources tractable.
Semi-automated standardisation
Pulling the data into one voice is the most important step. We usually do it with a tech-then-human-then-tech approach.
Different data sources throw up different proxies for value. LXP data might generate usage data - completions per skill for example. Search data will be measured in number of queries. A report on the future of skills in the sector might use the cost of recruiting for a skill as a metric.
The first thing we do is index these various metrics to a common scale, and line them up against a common skills framework. Through this we can see what the data taken together tell us. This can be visualised as a heatmap:
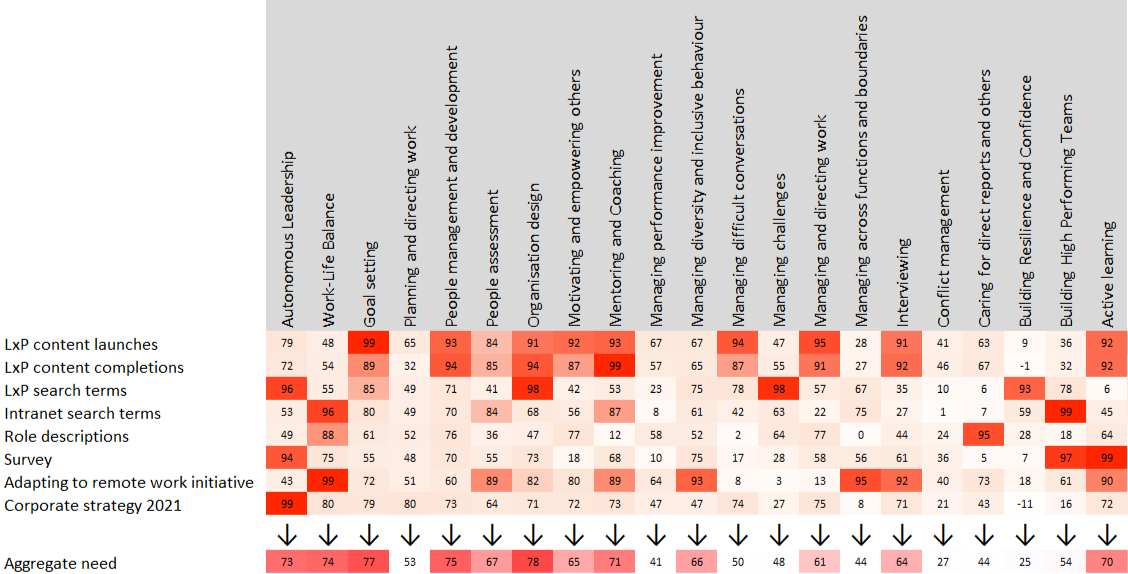
Once this heatmap is produced, experts can analyse this aggregated raw data consultatively with the client. This involves:
- Analysing whether there is a misalignment between top-down and bottom-up views (so, whether employees don’t need the skills management thinks they do; or employees aren’t upskilling/reskilling in line with longer term initiatives)
- Deciding whether certain skills need aggregating. If a group of skills aren’t hugely needed they can be pulled together into one umbrella skill.
- Deciding whether skills need disaggregating. If there’s huge demand for a broad skill it can be subdivided into more nuanced capabilities.
- Ensuring there are no duplications or misidentifications of skills. Often businesses have multiple skills under the same name. Or their definition of a skill doesn’t fit what they actually want that skill to achieve.
This last point is especially important for organisations looking to nail curation with data because Businesses rarely nuance their skills enough. Leadership for one organisation is not the same as another - and so the highest impact digital content won’t be the same either.
By understanding what employees are searching for and consuming, alongside business goals, we can help companies understand the exact skills they are actually looking for. Once this is done, we can approach the next set of data - content data.
Content Intelligence
Content Intelligence is our flagship technology for tagging content accurately and in a nuanced way by turning the text of content itself into data. Most learning content is tagged poorly, too broadly, or not at all. As a result, a huge proportion of learning is inaccessible. What remains is often irrelevant to learners or businesses, difficult to search for, and difficult to recommend.
The only traditional solution to this tagging problem is to manually read the content. Indeed, some companies still use human curators for just this. But, with 20,000 assets on LinkedIn Learning and 40,000 on Skillsoft, who has the time? Our answer is Content Intelligence. It ‘reads’ through the entirety of a client’s learning content provisions and tags it according to the predefined skills that we’ve worked with the company to pick. The tagged content is also scored and ranked according to how well it fits each skill.
Content intelligence use cases
Curation
This is the most obvious but most useful for businesses. With these tags, L&D can choose which content to put on their learning platform, personalise it to users, ensure it fits broader business goals, make search more effective, and generally make content more discoverable.
This tagging also helps with engagement. Say L&D wanted to send a newsletter/message out about a particular initiative. They could consult their Content Intelligence dashboard and quickly find the top 5 learning assets to support that initiative.
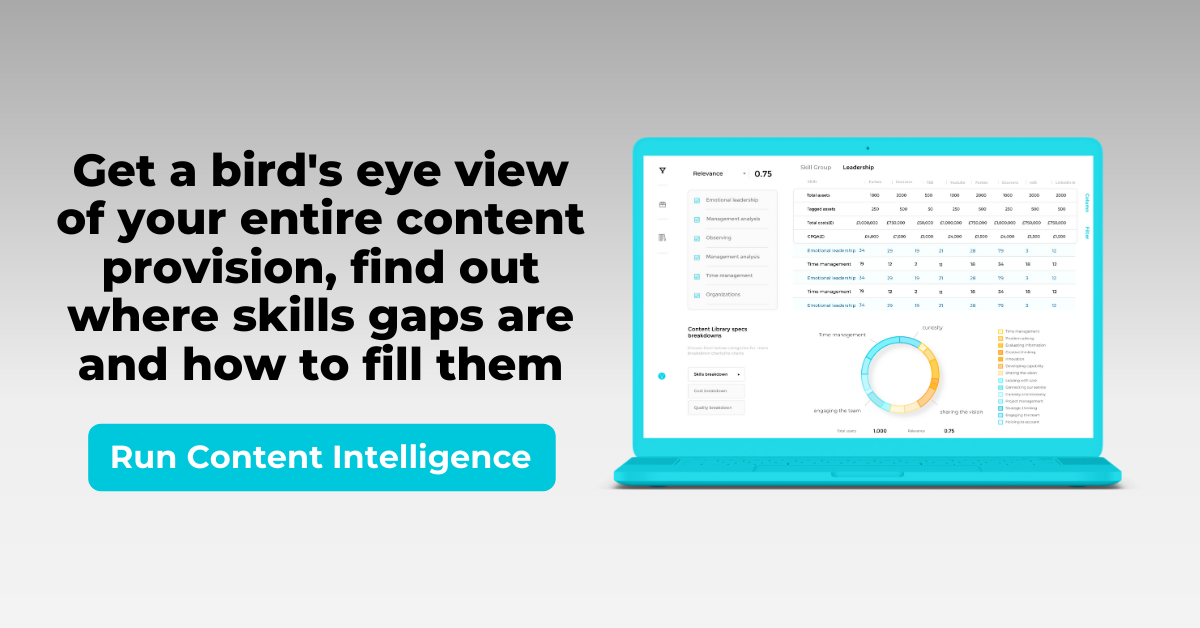
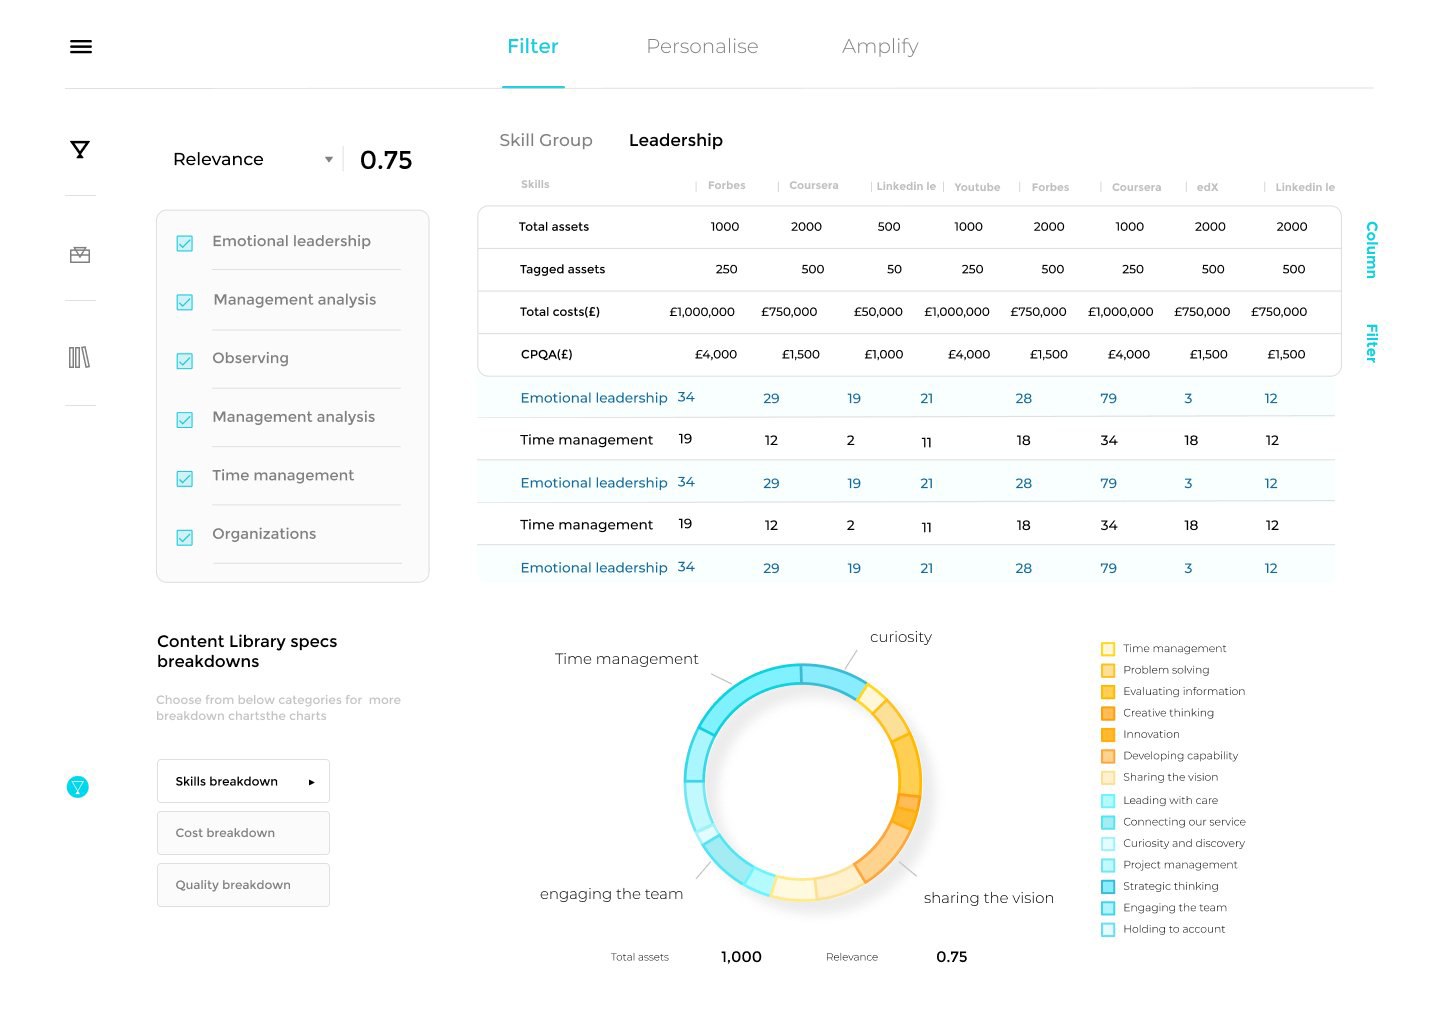
Library analysis
Businesses can also use this new tagging to generate data on the usefulness of their libraries themselves. They measure each library’s content provision against their skills frameworks. Clients use it to find out where skills gaps are, whether to swap out content libraries if they duplicate content, and which libraries better fit their skills needs.
With one pharmaceutical client, we were able to analyse their 3 main libraries according to skill coverage, content quality (via usage data), language coverage, and format. We did the same thing to 12 alternative libraries so they identify which providers complimented each other to best effect. Understanding the shape of each library in terms of skills and character allows L&D leads to select (and evidence) the optimal blend. So it’s still like playing Tetris, but now you get to select your next tile.
And this game gives you a lot more to win. By eliminating redundancies and focussing on streamlining rather than broadening content provisions, businesses can get more out of less content. In the past, clients have saved ⅓ of their content spend using this data analysis.
LXP and Engagement
On our smart LXP, we generate 5 main metrics:
- Opens
- Completes
- Relevance
- Usefulness
- Search
With these we can see which content is performing well and where gaps emerge. By looking at the ratios between these, clients can find out what learners want to learn, which content was high quality, and which wasn’t relevant.
We also segment this data by content and user. So, we can find out which skills are being found useful/relevant and which content formats work best for learners. At the same time, we can use the data learners gave us when onboarding onto our LXP to see which roles, departments, and seniorities are getting the most and least out of learning.
How clients use this data
Clients use this data to inform two levels of decision making. Strategic and tactical.
Strategic
Clients can decide what content their organisation should be focussing on - where skills gaps exist, and what type of learning is best received. They can also gauge learners’ overall priorities through search/open data.
Tactical
Engagement is another factor that can be measured by our LXP. Clients can see where users are most engaged within the instance - what content and messaging is most effective. Externally, they can also see which communications (emails, MS Teams messages) are driving people to the platform or keeping them engaged.
The secret is the consultation
As with most data transformations, the key to success lies in the human influence. Businesses do have a huge amount of data that can help their learning and accessing it is essential. But, without people who can get clear answers from disparate data and understand what those answers mean in an L&D context, organisations are working with hot air.
If this is the answer, the challenge is clear. L&D has rarely had the numbers or funding to hire, upskill, or outsource that expertise. However, with 93% of businesses claiming they see upskilling/reskilling as the number one priority in 2021, L&D departments might be able to leverage their new importance to get the foundations for an effective data strategy in place.