Making better spending decisions
TLDR: Buying content is difficult. There’s so much, it’s not clear where the most important data lies and there’s so much fuzzy overlap between vendors with different taxonomies. But a new metric - Cost Per Qualifying Asset (CPQA) - can be of great use to those involved in these important decisions for the workforce, enabling side-by-side comparisons of libraries of very different sizes.
More and more, L&D departments are getting intentional about how they choose their learning content and how they make the most of it. Budgets are tightening, and the requirement for hard data to support increased or continued spend is higher than it’s been for a long time.
We’ve previously offered advice on how to select the right vendor and run a fair and effective RFP.
We’ve also written about how to make content more discoverable through fit-for-purpose, scalable algorithmic tagging. And earlier this year, we wrote in HBR about curating content and building pathways that are likely to land well.
Today, with the calendar year coming to an end, and many L&D departments looking for ways to rationalise spend, we want to focus on a very specific metric which we introduced to the industry: the Cost Per Qualifying Asset or CPQA.
All-you-can-eat
[Optional aside: the all-you-can-eat buffet is dying a slow death, while the concept and practice of precision nutrition is growing.]
The standard content offer from libraries, aggregators and crawlers is all-you-can-eat. All your users can be able to access all the content, all the time. What’s not to like? A few things, actually.
The gap between the proposition and reality is vast.
Instead of all your users accessing content all the time, what happens is that very few access any content any of the time.
Beyond the disingenuousness of the value proposition, there’s also the difficulty of getting to the data that matters, the content that gets picked up, and the users that pick that content up. Content vendors might like to maintain a conversation about large numbers, but you will have different motivations.
Lots of content is overwhelming. 800 assets about project management is almost certainly worse than 100. The paradox of choice is well-documented and now widely understood and accepted. (Our company’s philosophy, name and domain name all emanate from this idea.)
More assets mean less data-per-asset. With a huge inventory, you’re not going to get much usage data for each learning asset you stock. And if you can’t monitor it you can’t manage (retire, delete, promote, pause, etc) it.
More assets from multiple vendors - which didn’t create their content symbiotically - makes for more messy overlap which is difficult to untangle.
A la carte
In the face of these problems, we’ve introduced a metric to help organisations buy the learning content they need: Cost Per Qualifying Asset (CPQA)
It’s simple to calculate.
First, what’s the price of the content? Let’s say it’s £50k per annum.
Then, of the vendor’s however many assets, how many are relevant to and fit for the purpose of your organisation? We mean those that demonstrably relate to the skills and topics that are important to you. Let’s say there are 1,000.
The CPQA in this example, is, then, £50k / 1k = £50.
CPQA is a value-for-money metric which can be used to benchmark libraries of different sizes. When you have this for multiple providers you can generate a table like this to make like-for-like comparisons:
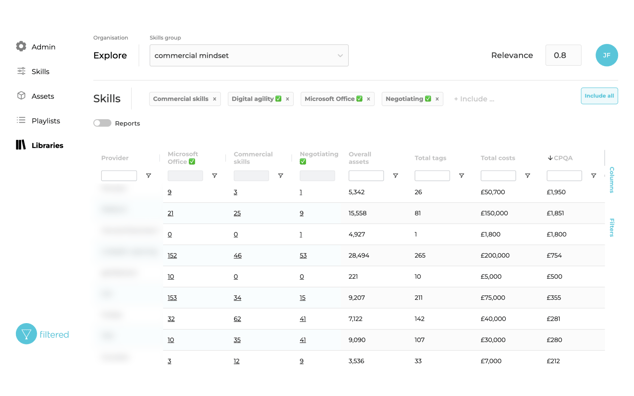 This is real data for real skills but redacted for obvious reasons.
You can see here a list of providers on the left (note that this can include 3rd-party libraries, the web as well as proprietary content), the count of the relevant assets for several (digital) skills, the total number of assets, the cost and the CPQA. The providers have been ordered by decreasing CPQA and so we can see that the provider at the top of this list is expensive, costing almost £2,000 for each relevant asset. That’s high but note that that doesn’t necessarily rule the provider out - it may be that this vendor’s content is especially brilliant or in-depth or specialist that it’s worth paying the substantial premium. Still, you should go into your buying process knowing what that premium is.
Note the 0.8 threshold in the top-right. The table would show similar insights and patterns but with slightly smaller numbers if we raised this to, say, 0.9. And the reverse would be true if we lowered it to, say, 0.7.
If you’re interested in curation, you can jump straight from this table to a filtered (lowercase f!) view of provider x relevance score x skill by clicking on any of the hyperlinked numbers in the table.
Finally, these are real data for a set of digital skills chosen to illustrate this point. Different providers would do worse / better / differently for a different set of skills with different definitions. And of course the results you would care about would be for the skills and topics that are a priority at your organisation.
Other factors
The table above is a truth, an important truth but not the whole truth.
As we discuss in our long-form Buyer’s Guide to Learning Content (really, if you’re considering buying content, you should read this), there are at least seven other factors you should consider when buying content to overlay to table of relevance above:
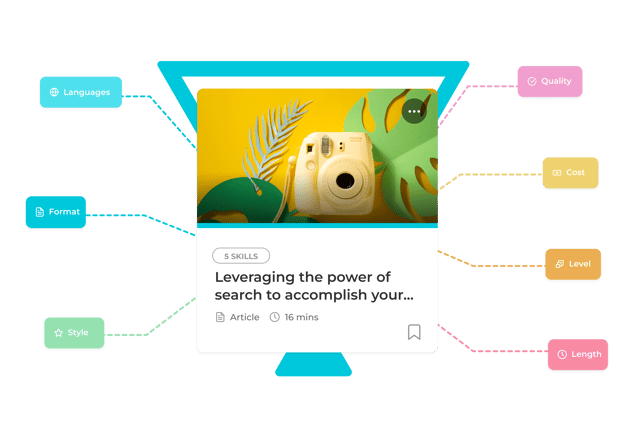
Some of these (languages, length format, and occasionally level) you’ll get straight from the metadata from the client. Some require more qualitative consideration. Content Intelligence can do a lot of the data organisation here.
A short note on length in particular. Vendors often emphasis the size of their libraries by the number of items they have in them. But of course the size of the library is a function both of the number of books as well as the number of pages in those books. Or in our case the length of the assets multiplied by the number of assets. In the preference for and rush to short-form content, length, depth and sophistication are too frequently overlooked. A 2-month Coursera course is very different to a 4-minute Business Insider article. There may be space for both on your learning system’s shelves but the impact and value will be vastly different.
And of course, the goal here is not to compare sources to see which wins; the goal is to determine which combination of courses gives you the coverage you need.
You can then use the CPQA to negotiate with candidate vendors, using hard data as a starting point rather than other, subjective, intractable factors.
To conclude, we suspect that the future pricing model for learning content will look a lot more like this (needs-based and data-informed) and that’s a good thing for the industry. The CPQA is a measure that will accelerate this shift from the indiscriminate all-you-can-eat approach to a more considered, precise, measured and intentional paradigm.
Need help prioritising your learning content needs?
