I originally gave this workshop with Michelle Parry-Slater and Lucinda King at Learning Live 2019. Here are the key takeaways and data-driven insights we uncovered on the project.
.png?width=1280&name=Learning%20Live_%20How%20to%20harness%20a%20data-driven%20learning%20strategy.pptx%20(1).png)
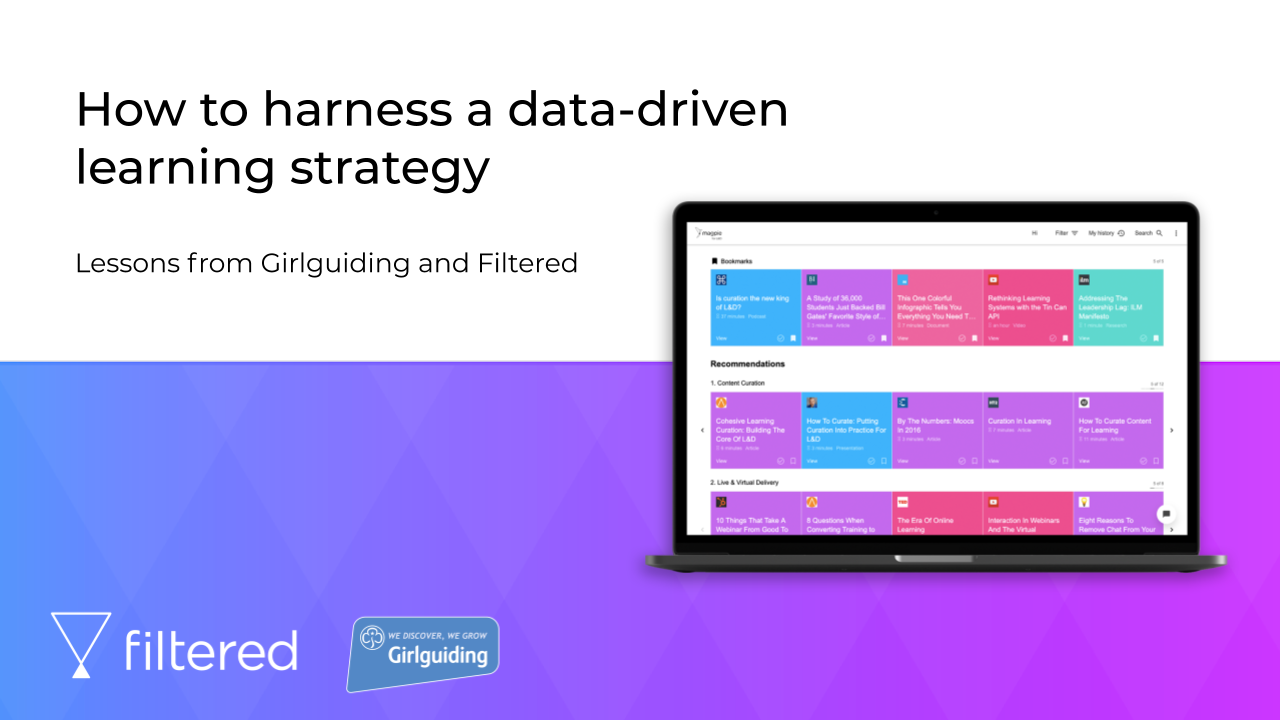
- At the beginning of 2019, Girlguiding commenced a pilot implementation of Filtered, Filtered’s AI-driven learning recommendations engine
- The project involved the curation of internal and external resources and delivery to an audience of between 500 to 1000 volunteers
- An overarching aim of the pilot was to gather hard data to support the learning strand of Girlguiding’s digital transformation initiative. The intention is to use this data to make informed decisions about the next steps to take on this journey.
.png?width=1280&name=Learning%20Live_%20How%20to%20harness%20a%20data-driven%20learning%20strategy.pptx%20(3).png)
- Filtered is an intelligent learning recommendations engine. It uses machine learning to understand learning content, understand learners, and connect the two effectively, so that learning within organisations becomes much more relevant to individuals needs and objectives.
- We take learning resources from all across organisations and centralise them, and then map them against a skills framework so we can prioritise the content we surface to users.
- And the more learning that takes place, the more we are able to understand about learners' needs and motivations. As a result, we’re able to make better recommendations continuously and generate a lot of actionable data in the process.
.png?width=1280&name=Learning%20Live_%20How%20to%20harness%20a%20data-driven%20learning%20strategy.pptx%20(4).png)
- For a long time, Learning and Development has suffered from a lack of useful data. Part of this problem has derived from the technologies that organisations have been using. The LMS is a great tool for managing learning and reporting that people have completed training modules. This is especially important in the context of compliance.
- But in terms of measuring learning effectiveness and making the link back to organisational performance, the LMS isn’t such a great tool. This is one of the factors that contributes to L&D being viewed as a cost centre, rather than a source of value. As an industry, we haven’t had the tools to provide insight that the wider business cares about.
- But today, there are technologies out there that are able to provide useful data that goes beyond completions and happy sheets, and can alter how learning teams within large organisations operate quite dramatically.
- There’s a broader dataset which can provide insight into the wider context of how and why people actually learn on the job, and really shape organisations’ learning strategies so that they’re more aligned with the business’s objectives.
- And Filtered is able to provide insight into three key areas:
- People
- Learning content
- How to manage learning effectively
.png?width=1280&name=Learning%20Live_%20How%20to%20harness%20a%20data-driven%20learning%20strategy.pptx%20(5).png)
- The first area we can use data to provide insight is people. We can help organisations answer questions like:
- What are the characteristics of engaged learners?
- Which roles are most engaged with self-directed learning?
- Which audiences find what interesting?
- What are the organisation’s strengths, priorities and gaps?
.png?width=1280&name=Learning%20Live_%20How%20to%20harness%20a%20data-driven%20learning%20strategy.pptx%20(6).png)
- The first thing we’re able to do is get a bird’s eye view of engagement across the organisation and are able to segment the audience more effectively.
- We can see which roles and departments are keen to learn, and which audiences prove hard to reach. This is stuff that marketing departments have been doing for a long time, but it’s very important. When creating learning experiences and resources, we’ve got to stop treating learners as a homogenous mass. It’s common for solutions to be designed for the ‘average learner’, when in reality there’s no such thing.
- By doing so, we can see the motivations and behaviours of different groups, so we can respond to them more accurately.
- One of Filtered’s recommendations to Girlguiding was to segment their ‘leader’ category further so that they can pinpoint the needs of specific types of learners within this cohort more effectively.
.png?width=1280&name=Learning%20Live_%20How%20to%20harness%20a%20data-driven%20learning%20strategy.pptx%20(7).png)
- One of the key user actions we track in Filtered is very simple but also very powerful and is used as training data so that our algorithm stack can make better recommendations.
- When a user completes a resource, they are asked to indicate whether they found the asset useful, whether they already knew it, or whether they thought it wasn’t useful.
- This is a lot more accurate indicator of whether learning resources are making an impact than a up/downvoting mechanism. It gives us an insight into whether someone felt that they would actually apply what they’d learnt, which we’re able to dig into downstream.
- So overall, in the context of Girlguiding, the relevance score was 88%, which is pretty good, but the usefulness score was slightly below the overall Filtered average. This suggested that a lot of users felt that they already knew a lot of the material available.
- We then looked at usefulness over time, and could see that after initial engagement, there was a significant uptick in usefulness, but it wasn’t as high as it could have been. This indicated that we needed to think more about what level of content was going to work for this audience.
- As a next step, we advised Girlguiding that they should hone in more on focussed learning needs through interviewing users, so more targeted material could be included into a future roll-out.
.png?width=1280&name=Learning%20Live_%20How%20to%20harness%20a%20data-driven%20learning%20strategy.pptx%20(8).png)
- The next insight was a really interesting one. When we engage with our clients, we always say that the data analysis we’re able to do is dependent on the quality of the questions they want answers to.
- Data is a tool you can use to test hypotheses and assumptions and that’s exactly what we did with Girlguiding.
- Based on self-reporting, one of Girlguiding’s initial assumptions was that more experienced volunteers would mark most assets they interacted with as ‘already known’. Whilst we can’t say with certainty that this is more of a myth than reality, the pilot dataset didn’t reveal a significant increase in the number of assets marked as ‘already known’ with length of Girlguiding experience.
.png?width=1280&name=Learning%20Live_%20How%20to%20harness%20a%20data-driven%20learning%20strategy.pptx%20(9).png)
- The next important area we can shed light on is around learning resources. Filtered’s data can help to answer questions like:
- Which formats have most impact?
- Which providers are delivering strong ROI?
- Which skills are in demand?
- Is the resource library aligned with learners’ revealed priorities?
- In a typical instance of Filtered, we include around 500 to 1000 individual learning resources. This is determined by a process of human curation undertaken by Filtered’s curation team and the client.
- This step is important because the ability to make good recommendations is dependent on the quality of content you begin with. If you put garbage in, you’ll get garbage out.
.png?width=1280&name=Learning%20Live_%20How%20to%20harness%20a%20data-driven%20learning%20strategy.pptx%20(10).png)
- This visualisation shows how well the resources we curated aligned with usage. In a well curated library, we’d expect to see skills lining up across the diagonal. Anything falling outside of the green areas is a strong indicator that we need to take a closer look.
- As we can see, Knowing Girlguiding was the most popular competency by a significant margin. As a result, there was a strong case to be made for boosting the number of assets in this category in future iterations of the platform. Additionally, it may be a good idea to split this area out into a set of specific sub-competencies.
- In contrast, the high provision of assets related to Your Wellbeing didn’t align with usage. Whist these assets weren’t engaged with by many users, those that did utilise them found them very useful. In light of this, Filtered’s recommendation was to look into whether these assets could have been signposted better, or whether an alternative title would have proved more engaging.
.png?width=1280&name=Learning%20Live_%20How%20to%20harness%20a%20data-driven%20learning%20strategy.pptx%20(11).png)
- Another question we looked into using the data was whether users could identify their learning requirements accurately. As you can see in this heatmap, there is more concentrated usage across the diagonal. This indicates that learners are following through on their initial stated preferences.
- That said, learners still tended to have a strong desire to explore content related to Knowing Girlguiding, Being an Inspiring Communicator and Being Curious and Creative.
- Based on the dataset, it’s difficult to determine why these competencies proved so compelling after users indicated their initial preferences. We recommended that Girlguiding interview learners to ask what led them to deviate from their top playlists.
- One hypothesis was that some competencies were avoided because they focussed more on longer-term skills development rather than materials that were immediately applicable.
.png?width=1280&name=Learning%20Live_%20How%20to%20harness%20a%20data-driven%20learning%20strategy.pptx%20(12).png)
- The next area we can explore using Filtered’s data are the most effective methods of driving engagement with learning. We can look into:
- The best ways to nurture habitual engagement
- The best times do nudge different audiences
- How to make the most of learning occasions
.png?width=1280&name=Learning%20Live_%20How%20to%20harness%20a%20data-driven%20learning%20strategy.pptx%20(13).png)
- We found that Girlguiding’s activity had a unique pattern of weekly engagement. We’d normally expect to see consistent usage during the week, and a sharp drop-off at weekends.
- For Girlguiding, we instead observed a tendency for learning to happen at the beginning and ends of weeks. Based only on the pilot dataset, we weren’t able to establish cause and effect.
- That said, the trend led us to speculate as to whether Filtered usage is linked to events taking place during weekends. For Girlguiding, this was a very useful insight as it revealed that the date they sent learning communications out didn’t align with the peak learning days.
.png?width=1280&name=Learning%20Live_%20How%20to%20harness%20a%20data-driven%20learning%20strategy.pptx%20(14).png)
- Based on the pilot, we learned that:
- Girlguiding’s audience is receptive to personalised learning
- Although the curated content was useful, it could be more useful
- There is a strong preference to learning about Girlguiding from Girlguiding
- Girlguiding should continue to offer and produce learning materials in a range of different formats
If you’d like to harness a data-driven learning strategy at your organisation, please get in touch.