TL;DR. If you have more than 10,000 people in your organisation, you could save up to £870k by simply removing overlapping content. Here's how GSK and AstraZeneca did it.
Filtered uses its Content Intelligence technology to deliver cost savings of six or even seven figures for customers like GSK and AstraZeneca.
By using data generated by Content Intelligence to inform decisions to drop a vendor or to renegotiate a contract, these customers are able to save anywhere between 30% and 50% of their learning content budget.
They also make significant savings on other work involved in managing large content libraries (NatWest identified a 20% saving on curation, for example).
So we wanted to ask - how can other organisations, who all invest heavily in learning content, save £300k like GSK?
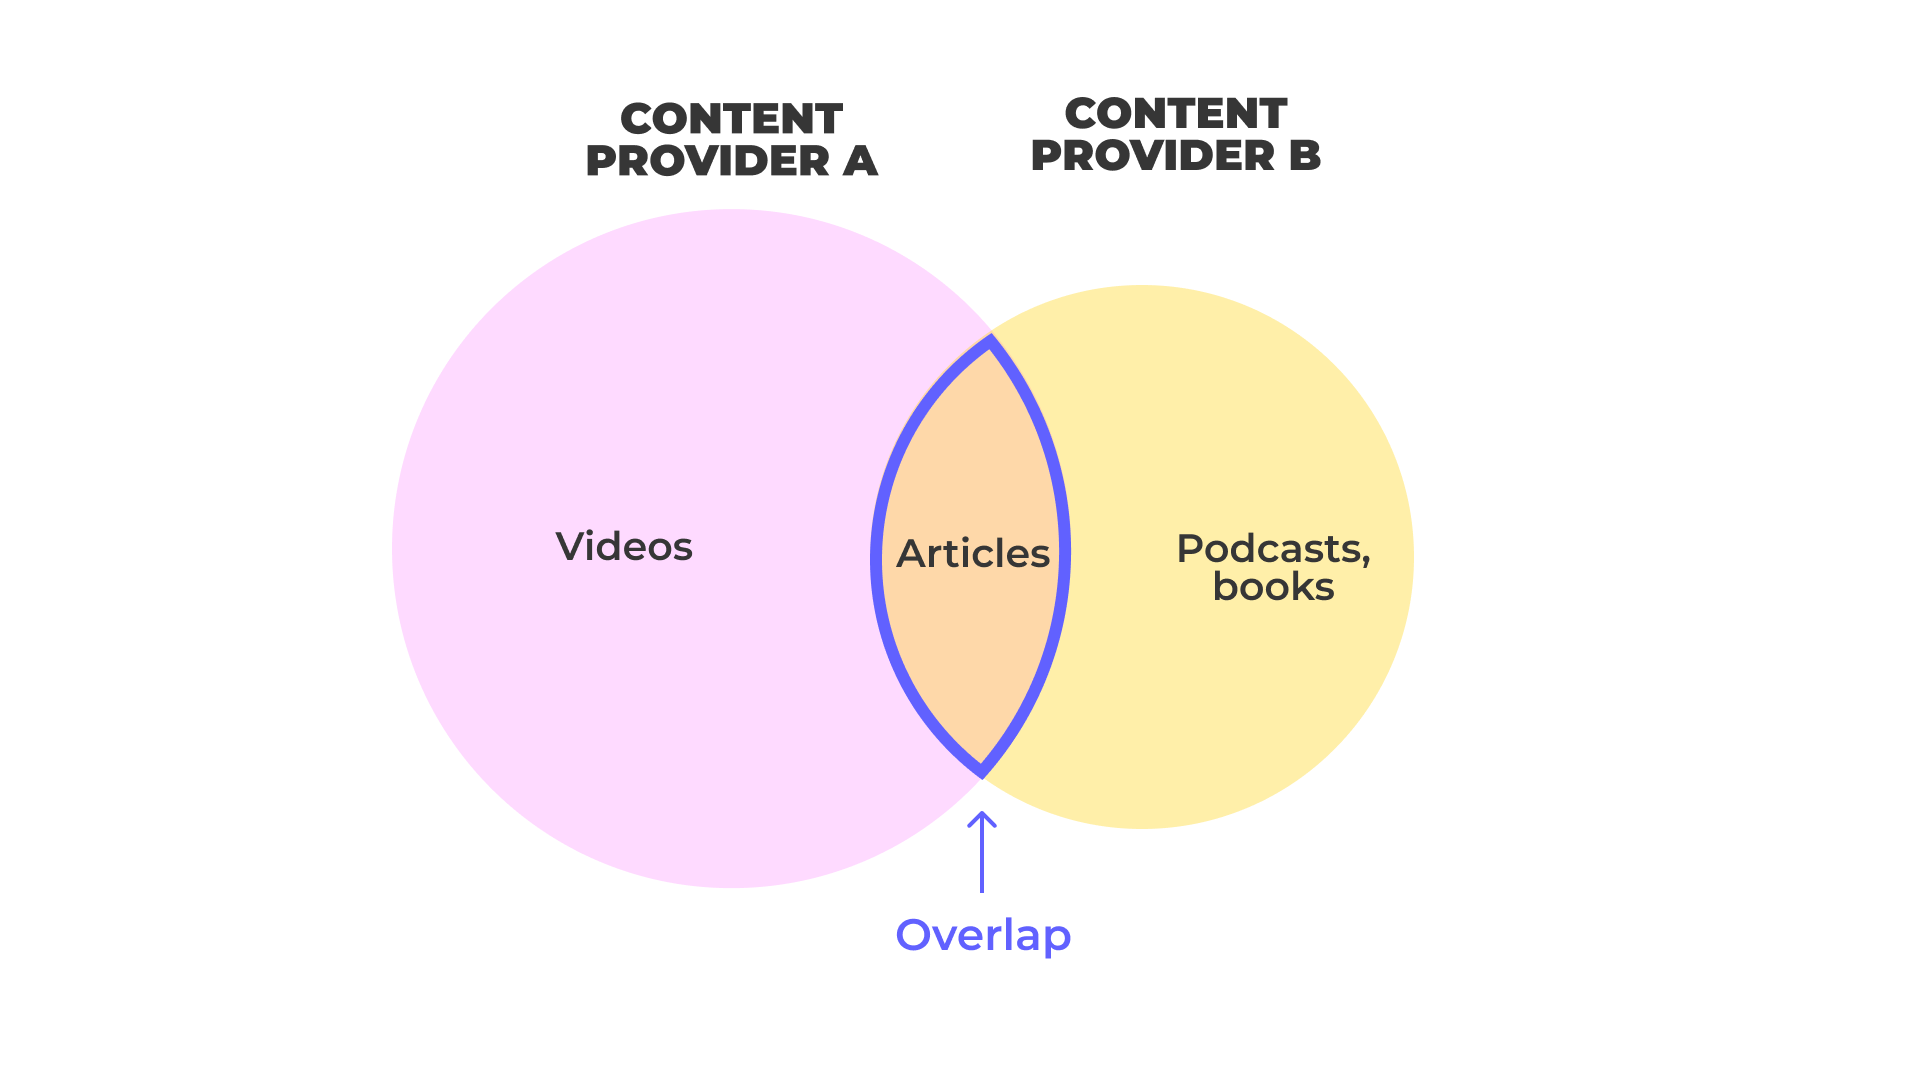
Well, the key thing for saving money on content is identifying overlap: the same content, covered in the same format.
No big deal, you might say, people like choice! But actually, this kind of overlap is a serious issue:
- It costs money directly: you are licensing almost identical content from multiple sources.
- It costs staff time: our analysis shows managing content is a big part (42%!) of L&D’s job. Overlap means literally twice the curation and maintenance work per learning asset,
- It makes for a poor user experience. Faced with decision-fatigue, learners pick up the phone to L&D and have conversations which add to yet more direct costs:
- We have to develop new content because ‘no one can find anything’, or
- We invest extra effort in curating pathways to highlight the ‘right’ course
To find out, we looked across Filtered’s datasets, which are sourced from working with 20+ enterprise-sized organisations (all with 10K+ employees and multiple content libraries), to see if there was a pattern. Looking only at paid-for content, we found an average overlap of 20%.
Then we looked at the cost of this overlap: how much does L&D spend in terms of licences and people on buying, maintaining and curating this overlapping content. In other words: what is the cost of Content Chaos?
The shocking answer? At least £9.1 billion.
The reason this figure is so high is that the fully-loaded cost of content (the salaries of the people involved in buying and maintaining it) constitutes a huge 41.8% of L&D spending.
Even if you take the low end and look at direct spending on content licenses alone, the wasted money on duplicated content still amounts to £3.7 billion per year.
That means – for a 10,000 person organisation, at the average content and L&D cost per employee – applying Content Intelligence can save you between £350,000 - £870,000.
Whatever you're planning in the next budget cycle, a saving of that magnitude is worth looking into. Arguably, it’s negligent not to. The downstream cost of the chaos is worse L&D outcomes: attrition, people not upskilling and the trillions that skill gaps cost us in terms of performance.
Do you need some help to think about how hard your content budget is working for you?

How did we work this out?
There are two stages to the calculation:
- How we identified the overlap
- How we calculated the cost
1. How we identified the overlap
We defined overlap to be the proportion of content where more than one provider contributed assets for a given format + skill segment. For example, if two providers contribute assets relevant to Authentic Leadership, but one contributes videos and the other articles, we judge that there is no overlap. But if one contributes 15 articles and the other 5 articles, we judge those 5 assets to be overlapping.
(Our customers also look at factors that influence organisational relevance: proficiency level, language coverage, duration and recency, thus sharpening the final selection. We chose format and skill segment because format clearly signals overlap to a user, ie “what, four courses on scaling agile?”).
We chose sets of providers typical of enterprise clients: a large structured course library; a MOOC platform; and a catalogue of book summaries. We used a skills framework employed in a real-world project, representing enterprise-wide knowledge worker skills. We then checked our results against a skill framework which is freely available to all: the Filtered Skills Palette.
Here’s what we found:
- If you only look at the course format, the average overlap is 31%
- If you look at a different format, for example ebooks, it falls a bit to 28%
- And if you look across all formats, the average overlap is at least 20%
In other words, we estimate 20% of the total learning content load for any organisation overlaps.
This proportion rises if any of the following conditions apply:
- There are more than three content libraries in place
- We include internally-developed content in the comparison
- We include freely available content, curated from the web
That’s why Filtered clients tend to realise savings of 30-50%, rather than only 20%.
2. How we calculated the cost
To understand how much this overlap might cost large organisations, we turned to several more data sources.
We limited ourselves to organisations with 10,000 employees or more using the data at Marketcap. There are 1,845 of these, employing ~105 million people).
This is a tiny fraction of the total number of companies in the world and their employees, which is why we say ‘at least’ because smaller organisations also buy, build and maintain lots of content.
To calculate the average spend, we used data from Statista and ATD which, between them, estimate average L&D spend per employee per year as £1,018.
Note: This will vary widely and not all companies will spend at this level. But it’s also on the low side. The roughly £1k figure applies across all organisations globally, and we’re only interested in 10,000+, which often spend much much more per employee (more like £2k) so once again this is why we say: ‘at least’ £9.1bn.
In total, this spending is about £108 billion amongst the 105 million companies with 10,000+ employees.And of this total spend, how much gets funnelled directly into content? The analysts at Brandon Hall provided us with this breakdown of L&D spending by area from their 2020 benchmarking report:
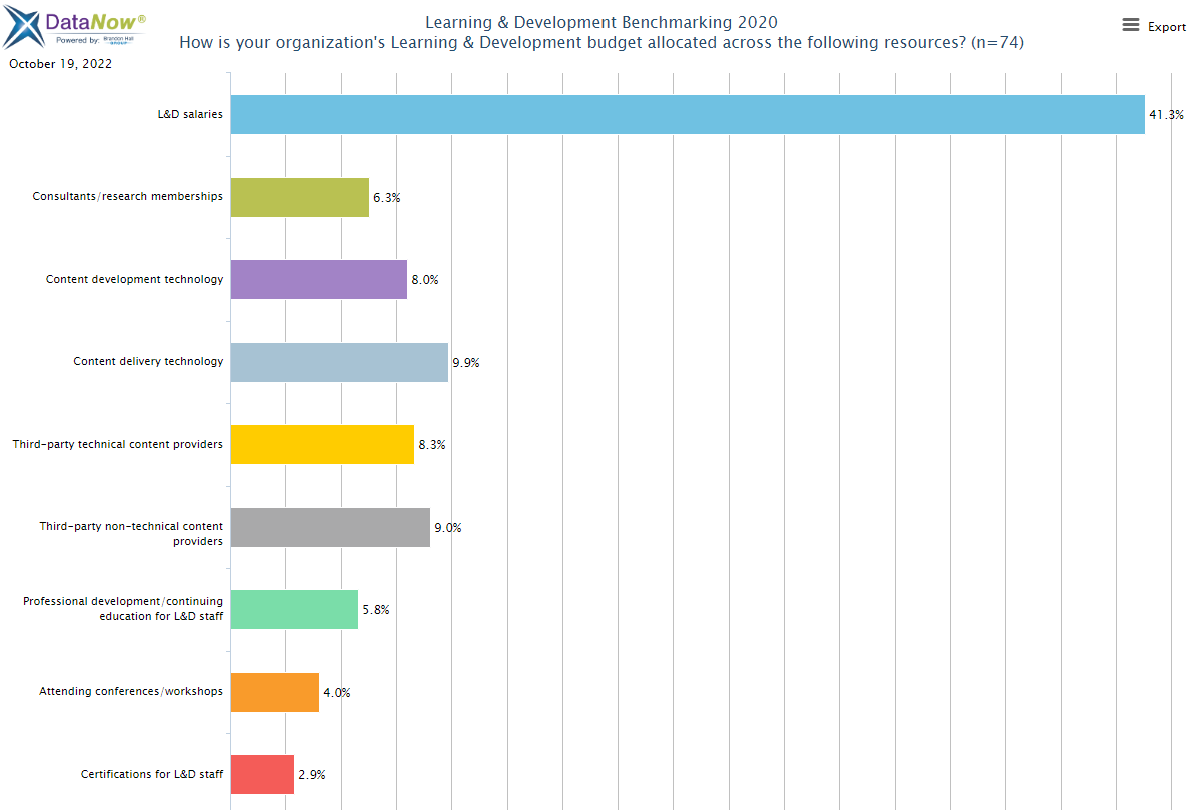
As part of that mix, direct spending on content providers makes up 17.3% of overall spending.
Scaled up to the overall spending by 10k+ firms, this figure alone suggests that £3.7bn (ie, 20%) out of an estimated £18.8bn is spent on overlapping content.
But direct spending on content licensing doesn’t tell the whole story.
We can ultimately reduce the Brandon Hall figures (and this is our maths, not theirs) to just three areas:
- spending on learning content
- spending on delivering training (in-person, or virtually)
- spending on platforms (ie, “content delivery technology”).
In other words: L&D salaries, consultants, conferences, certifications and professional development can all be allocated to the % of work going to building, buying or delivering content, delivering training, or buying and maintaining platforms.
Look at it this way and content absorbs a huge 41.8% of L&D spending.
This shouldn’t really be surprising: L&D is really about getting the right content or experience in front of the right people. If we take that number, some £45.4bn of L&D expenditure a year, and combine it with the overlap in content of at least 20%, we arrive at a much larger number: £9.1bn.
We can also use the lower and higher estimated numbers here (depending on whether you want to count just licenses or all the effort that goes into content) to estimate the likely cost of Content Chaos at your organisation as a proportion of your total L&D budget. It's between 3.5% and 8% of the total budget.
For a 10,000 person organisation, at the average content and L&D cost per employee, that's a likely savings range of £350k - £870k.