We think a lot about how to measure how good a recommendation is at Filtered. While there is no one ‘right’ way to assess this, having metrics that attempt to quantify how well our algorithms are performing helps us make progress. They let us build a sense of what works well, what doesn’t, and whether changes we make are improvements or otherwise.
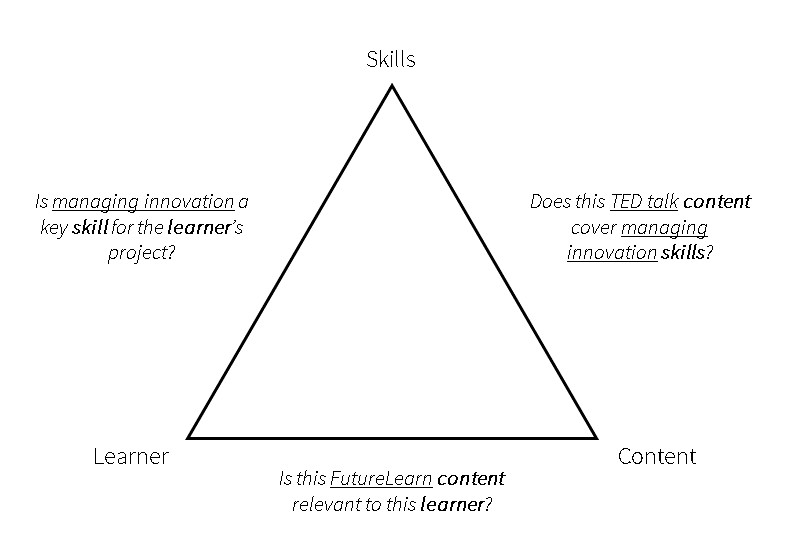
A lot of what our algorithms are trying to do is to choose between two options. For example answering questions like:
- is managing innovation a key skill for this project?
- is this FutureLearn course relevant to this individual?
- does this TED talk cover innovation?
High stakes
In the language of machine learning, these are binary classification problems: structurally the same as using a medical test to diagnose disease, or using facial recognition techniques to decide whether an individual is a smartphone’s owner. Because of their ubiquity, there is a well-established set of measures for this sort of classification, based on the confusion matrix. Here’s an example of a confusion matrix for medical diagnosis.
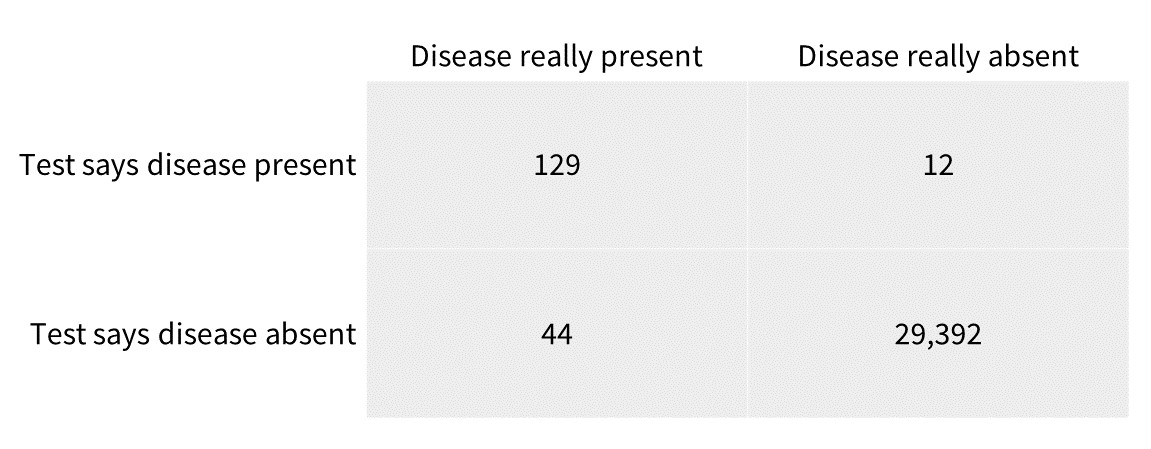
From these figures, quantities like precision (in the medical test example, the fraction of diagnoses where the disease is really present) and recall (again in this example the proportion of all true cases of the disease which the test identifies). These metrics might seem arid, but they matter if we are to design our tests well.
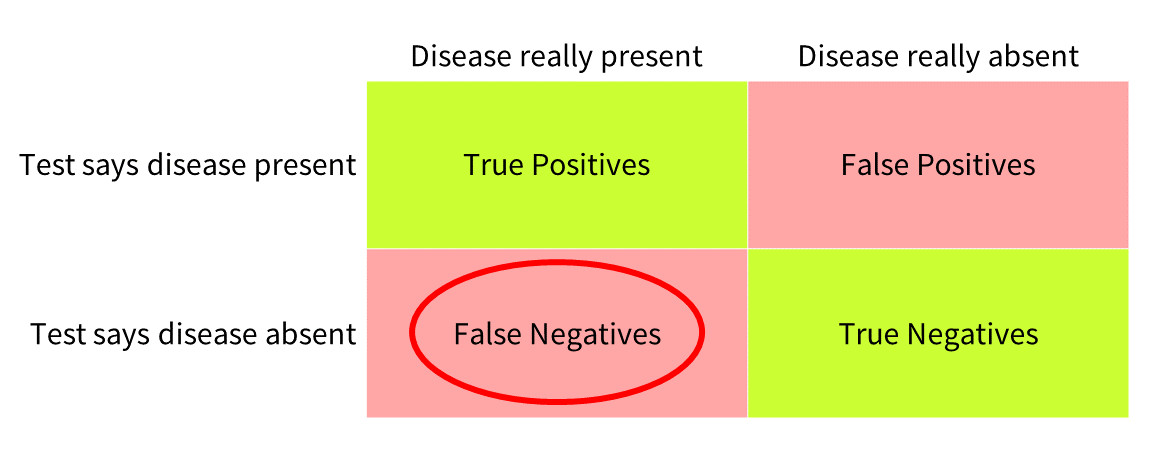
In medical diagnosis, of course we want to make the test accurate overall. But where it does fail, we might also want it to fail “in the right way”. It might well be better for the test to predict disease when it is absent than for the test to miss real cases of disease. The consequence of missing disease that could be treated can outweigh the harm and alarm caused by a ‘false positive’.
So for a medical test, we might want to minimise false negatives, even at the expense of increasing false positives. This sort of trade off is common in test design, and a hard but real choice.
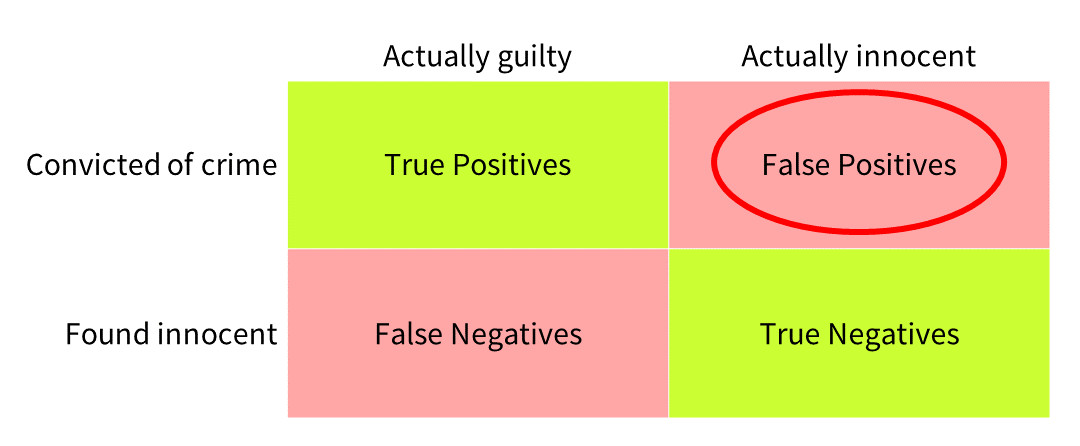
Conversely in the case of crime and punishment, the consequences of wrongful conviction seem worse than those of some offenders escaping justice. We might want to set the balance differently, and minimise false positives even at the expense of increasing false negatives.
But what about learning recommendations? As with the examples above, it depends on the relative consequences of making a recommendation that is not useful, versus failing to recommend something that would have been invaluable. This trade-off depends on the time the training would take, its opportunity cost, and the value of the skills that might be acquired - which of course change depending on circumstances. So in L&D we need to adapt the balance between risky and safe recommendations, depending on the situation. Which is why we use a suite of metrics at Filtered.
Low stakes

In the spirit of naked competitiveness, our CEO, Marc Zao-Sanders challenged our science team to pit their AI (magpie) against his MI (Marc Intelligence).
magpie is the set of algorithms that support our learning recommendation engine. Its job is to classify, structure and prioritise content so the right materials get to the right learner. One of the most easily measurable tasks within this stack is the one performed by the tagging algorithm. This takes a library of learning content and labels it with a framework of skills and attributes to make it more accessible to learners and amenable to personalisation in the recommendation engine.

The challenge was to categorise learning assets - Harvard Business Review articles - according to our productivity-supporting capability framework. Who could do the better job of classifying and curating this content?
The battle was fought over 200 articles, which both magpie and Marc had to tag with Filtered’s framework of 40 capabilities. Marc spent a little over two hours of precious CEO-time on the task, while magpie devoted 5 seconds of elapsed time on Amazon Web Services’ thrumming data centres. Their respective performance was compared with tagging using the rich native HBR tags, using our standard set of measures of performance within the product.
The results are in.
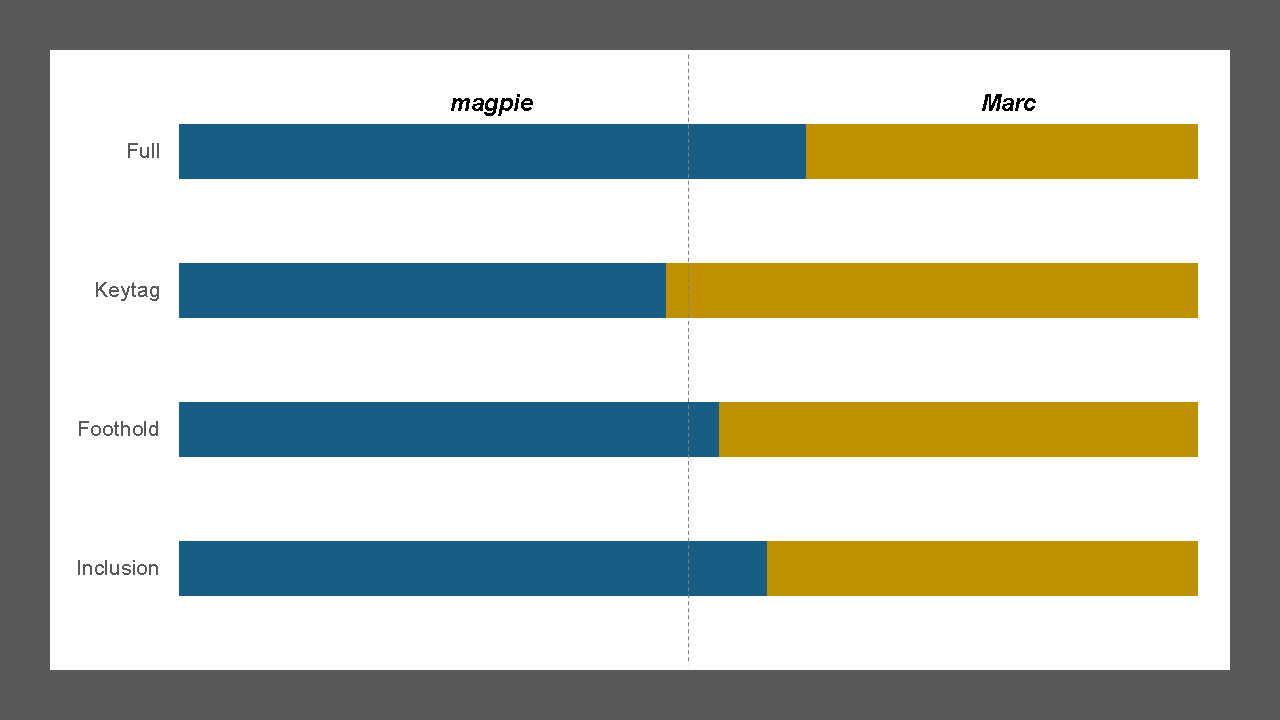
magpie performed better in three of the four metrics:
- Full, which is a measure of how well either could fully identify the HBR tags applied to an article;
- Foothold, which measures their capability to identify any of the native HBR tags; and
- Inclusion, which measures the average proportion of native tags predicted correctly
Marc beat magpie, very marginally, in the Keytag metric, which assesses how well the main thrust of the article has been identified. So there is enough of a challenge for magpie to request a rematch in a few months' time.
If you are interested in pitting your wits against magpie, helping us in our research, discussing metrics, tagging content, or leveraging the power of learning recommendations in your organisation, please get in touch!
= = = = = = = = = = = = = = = = = = =
Find other articles like this
This post is part of a series that my colleagues and I at Filtered are working on. It’s broadly about how recommendations help us to make sense of all the content clutter, especially in learning. Have a look at our other posts here.
